
Every year, the European Union's (EU) 28 countries import 100’s of billions of dollars worth of goods and services from the USA. This year, the figure is expected to be >$0.5 Tn. In 2013, the USA and the EU remained, and have always been, each other’s largest export/import (>$1 Tn annual flow) and investor partners (>$300 Bn annual flow). This is not a new situation, the transatlantic relationship is key for US exporters, and is not one that is likely to change in the near future.
Over the next weeks we will be running three articles focused upon US exports to the EU. In the first one, we are going to look at who (which US states) in the USA is doing all that exporting to Europe, then we will study who (which EU countries…) is doing all that importing, and then finally we will dig down into detail of the products and services that the USA so consistently exports to, and that the EU wants to import, year after year… So watch this space.
We have two sources of information, on one hand the U.S. Department of Commerce and on the other the European Commission. Both organizations keep copious amounts of information with an interestingly different perspective. The exporter v’s the importer, the USD, the € as well as the £, cut off dates, products and services, all add to the complications for recording and reporting.
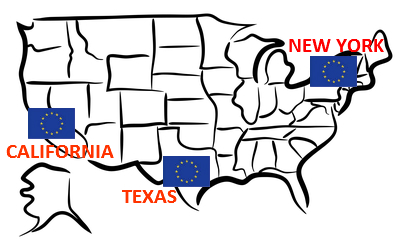 In the challenge table for 2013 (see below), we have the top twenty US states, the stars of US exports to Europe that together account for $200 Bn, a mighty 40%, and wherein for each US state the EU represents an average of 20% of their exports. They are led, perhaps unsurprisingly, by the powerhouses of the US economy: Texas (the top exporting state in the USA for the past 12 years) and California up there in a league of their own, with nearly $30 Bn each. Looking inside those exports in terms of goods we can see a wonderful array of petroleum and coal products, chemicals, computers and electronics, machinery, and transportation equipment and of course agricultural products. 3rd in the league is the Empire State, with some $16 Bn of products, commodities and a strong base of financial and related other services. Thereafter, in the $9-10 Bn export to EU range, we have the geographically dispersed Louisiana, Illinois, New Jersey and Pennsylvania, reflecting the strength and depth of the US to EU exports, ranging from petroleum and coal products, automotive, machinery to transportation equipment, and of course agriculture. Amongst the surprises that we find is that for six of these states (New Jersey, Indiana, Massachusetts, North and South Carolina as well as Kentucky) the EU represents >25% of their exports, making that transatlantic export linkage extremely important to those states' economic wellbeing. However, it is Delaware that wins the % prize with 39.7% of their exports headed for the EU, notably in the chemical sector (led by a wonderful company with a fine EU/French heritage…).

We close on a note to further endorse the US transatlantic success, and a non US state partisan headline, that the S&P US top 500 firms' average >24% of their sales are in the EU. Wow, imagine taking those numbers out of the US GDP equation…thanks EU ☺
| # | State | Value $Bn | % of exports |
| 1 | Texas | $29.7 | 10.6% |
| 2 | California | $28.2 | 16.7% |
| 3 | New York | $16.2 | 19.2% |
| 4 | Louisiana | $10.7 | 16.9% |
| 5 | Illinois | $10.3 | 15.5% |
| 6 | New Jersey | $9.3 | 25.5% |
| 7 | Pennsylvania | $9.3 | 22.6% |
| 8 | Washington | $8.8 | 10.7% |
| 9 | Indiana | $8.4 | 24.6% |
| 10 | Ohio | $8.1 | 15.9% |
| 11 | Massachusetts | $8.0 | 29.6% |
| 12 | Georgia | $7.1 | 18.9% |
| 13 | South Carolina | $6.8 | 26.2% |
| 14 | Kentucky | $6.2 | 24.4% |
| 15 | Florida | $6.2 | 10.2% |
| 16 | Connecticut | $5.9 | 35.6% |
| 17 | North Carolina | $5.7 | 19.5% |
| 18 | Michigan | $5.3 | 9.1% |
| 19 | Tennessee | $5.3 | 16.3% |
| 20 | Alabama | $4.3 | 22.4% |
| Total | $199.8 | Avg 19.4% |
Source: U.S. Department of Commerce; International Trade Administration; Office of Trade and Industry, Manufacturing and Services (2013)